How to write any scientific text
https://weitzlab.seas.harvard.edu/files/weitzlab/files/131.5_weitzlab_guide_to_good_paper_writing_10-2012.pdf
Latex madlips article template: https://www.overleaf.com/read/kmvdcphrtfjy
How to make figures
http://journals.plos.org/ploscompbiol/article?id=10.1371/journal.pcbi.1003833
- Use this colormap for lines: first colors Blue, Blueish green and Vermillon (=blue-green-red) and avoid yellow
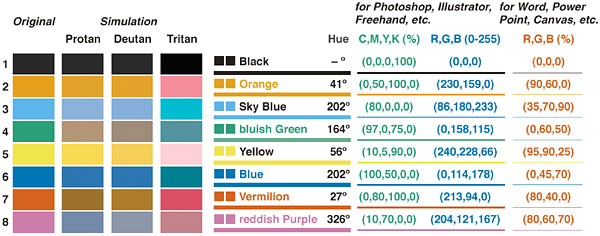
http://jfly.iam.u-tokyo.ac.jp/color/image/pallete.jpg
- maximize new data per ink ratio (every drop of ink tells something new, do not repeat unnecessary colors or elements)
- Labels: variables are with italics, then two spaces and then units in square brackets (standard in physics)
- Minimize white area in plots by adjusting axis range
- lower left corner is origin (0,0) if possible
- 0 is marked as 0 not as 0.0 or 0.00
- In multiple curves, mark curve labels above each curve with the curve color
- avoid legends as they are not intuitive
- with multiple panels (a,b,c) do NOT repeat labels or legends
- if there is a parameter sweep, mark the increase of parameter with an arrow over the curves
- aspect ratio of axis = golden ratio
- figure width = 88 mm (width of PRL two column format)
- text size 11 or 12 points (this is about 4 mm)
- in powerpoint: 24pt with standard slide size (10″ by 7.5″)
- show all four axis (left right top bottom)
- label panels in top right corner with bold face a, b, c, d, etc…
- or a) or (a)